


NADP+/NADPH Colorimetric Assay Kit (WST-8)
Couldn't load pickup availability

Still have questions? Ask our experts!
NADP+/NADPH Colorimetric Assay Kit (WST-8)
| SKU # | E-BC-K803-M |
| Detection Instrument | Microplate reader (450 nm |
| Detection method | Colorimetric method |
Product Details
Properties
| Synonyms | NADP/NADPH |
| Sample type | Animal tissue, cells |
| Sensitivity | 0.02 μmol/L |
| Detection range | 0.02-5.0 μmol/L |
| Detection method | Colorimetric method |
| Assay type | Quantitative |
| Assay time | 70 min |
| Precision | Average inter-assay CV: 5.500% | Average intra-assay CV: 2.100% |
| Other instruments required | Test tube, Micropipettor, 37℃ water bath, 10 KD filters tube. |
| Other reagents required | Ultrapure water |
| Storage | -20℃ |
| Valid period | 12 months |
Images
T P Cimmino et al investigate the function of formyl-peptide receptor 2 signaling in anabolic pathways. Ratio of NADP+/NADPH in cell was determined using NADP+/NADPH colorimetric assay kit (E-BC-K803-M).T P Cimmino et al investigate the function of formyl-peptide receptor 2 signaling in anabolic pathways. Ratio of NADP+/NADPH in cell was determined using NADP+/NADPH colorimetric assay kit (E-BC-K803-M).
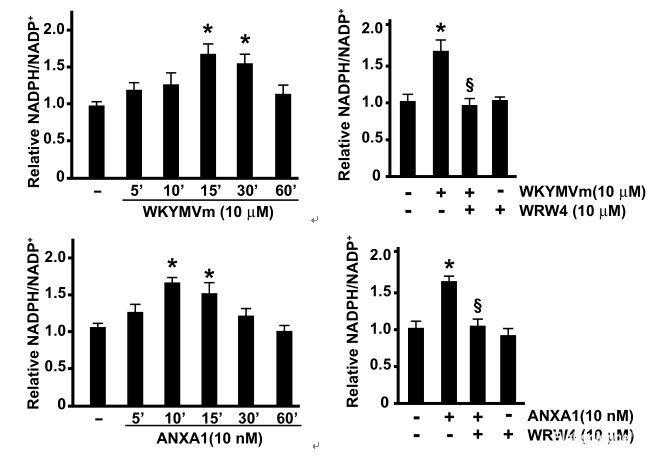
The ratio of NADP+/NADPH was significantly changed in different groups. (P<0.05).
Dilution of Sample
It is recommended to take 2~3 samples with expected large difference to do pre-experiment before formal experiment and dilute the sample according to the result of the pre-experiment and the detection range (0.02-5.0 μmol/L).
The recommended dilution factor for different samples is as follows (for reference only):
| Sample type | Dilution factor |
| Jurkat cells | 1 |
| Mark cells | 1 |
| HCT116 cells | 1 |
| 293T cells | 1 |
| 10% Mouse kidney tissue homogenate | 1 |
| Hela cells | 1 |
Note: The diluent is reagent 1.
Detection Principle
Detect total content of NADP+ and NADPH: Glucose 6-phosphate (G6P) is oxidized to 6-phosphate gluconolactone (6-PG) by glucose-6-phosphate dehydrogenase (G6PDH), and NADP+ is reduced to NADPH during this reaction. NADPH, under the action of 1-mPMS, transfer electrons to WST-8 to produce the yellow product, which has a characteristic absorption peak at 450 nm. Therefore, the total content of NADP+ and NADPH can be quantified by measure the OD value at 450 nm. Detect NADPH: After treating sample, heat at 60℃ water bath for 30 min. the NADP+ of the sample is decomposed and only NADPH remains. NADPH reduces WST-8 to form Formazan, and the amount of NADPH is determined by measure the OD value at 450 nm. Detect NADP+ and NADP+/NADPH: The content of NADP+ and the ratio of NADP+/NADPH in the sample can be obtained according to the total content of NADP+ and NADPH obtained of the first two steps as well as the separate content of NADPH.
Kit Components & Storage
| Item | Component | Size (96 T) | Storage |
| Reagent 1 | Extracting Solution | 60 mL ×2 vials | -20℃, 12 months |
| Reagent 2 | Buffer Solution | 12 mL × 1 vial | -20℃, 12 months |
| Reagent 3 | Chromogenic Agent | 1.2 mL × 2 vials | -20℃, 12 months, shading light |
| Reagent 4 | Enzyme Reagent | Powder × 2 vials | -20℃, 12 months |
| Reagent 5 | NADPH Standard | Powder × 1 vial | -20℃, 12 months, shading light |
| Microplate | 96 wells | No requirement | |
| Plate Sealer | 2 pieces |
Note: The reagents must be stored strictly according to the preservation conditions in the above table. The reagents in different kits cannot be mixed with each other. For a small volume of reagents, please centrifuge before use, so as not to obtain sufficient amount of reagents.
Technical Data:
Parameter:
Intra-assay Precision
Three human serum samples were assayed in replicates of 20 to determine precision within an assay (CV = Coefficient of Variation).
| Parameters | Sample 1 | Sample 2 | Sample 3 |
| Mean (μmol/L) | 0.42 | 2.60 | 4.30 |
| %CV | 2.4 | 2.2 | 1.7 |
Inter-assay Precision
Three human serum samples were assayed 20 times in duplicate by three operators to determine precision between assays.
| Parameters | Sample 1 | Sample 2 | Sample 3 |
| Mean (μmol/L) | 0.42 | 2.60 | 4.30 |
| %CV | 5.3 | 5.1 | 6.1 |
Sensitivity
The analytical sensitivity of the assay is 0.02 μmol/L. This was determined by adding two standard deviations to the mean O.D. obtained when the zero standard was assayed 20 times, and calculating the corresponding concentration.
Standard Curve
As the OD value of the standard curve may vary according to the conditions of the actual assay performance (e.g. operator, pipetting technique or temperature effects), so the standard curve and data are provided as below for reference only:
| Concentration (μmol/L) | 0 | 1.0 | 1.5 | 2.0 | 2.5 | 3.0 | 4.0 | 5.0 |
| Average OD | 0.081 | 0.405 | 0.574 | 0.767 | 0.895 | 1.132 | 1.454 | 1.855 |
| Absoluted OD | 0.000 | 0.324 | 0.493 | 0.686 | 0.814 | 1.051 | 1.373 | 1.774 |