


Glutathione-S-Transferase (GST) Activity Assay Kit (DTNB Method)
Couldn't load pickup availability

Still have questions? Ask our experts!
Glutathione-S-Transferase (GST) Activity Assay Kit (DTNB Method)
| SKU # | E-BC-K800-M |
| Detection Instrument | Microplate reader (400 nm-420 nm, optimum wavelength: 412 nm) |
| Detection method | Colorimetric method |
Product Details
Properties
| Synonyms | GST |
| Sample type | Serum, plasma, animal tissue |
| Sensitivity | 2.1 U/L |
| Detection range | 2.1-92.8 U/L |
| Detection method | Colorimetric method |
| Assay type | Enzyme Activity |
| Assay time | 65 min |
| Precision | Average inter-assay CV: 6.400% | Average intra-assay CV: 1.800% |
| Other instruments required | Test tube, Micropipettor, Vortex mixer, Centrifuge, 37℃ incubator |
| Other reagents required | PBS (0.01 M, pH 7.4) |
| Storage | 2-8℃ |
| Valid period | 12 months |
Images
O A Afolabi et al evaluate the testicular torsion management with multiple method of treatment. Glutathione-S-Transferase (GST) activity in rat testicular tissue was determined using GST colorimetric assay kit (E-BC-K800-M).
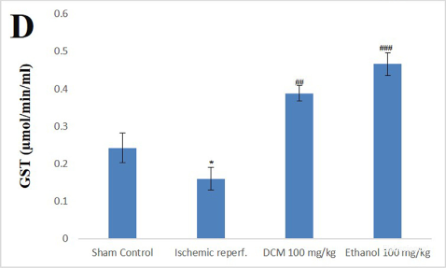
The activity of GST was significantly decreased by ischemic reperfusion, and increased by DCM and ethanol. (*P<0.05 vs. control, ##P<0.01, ###P<0.001 vs. reperfusion injury)
Dilution of Sample
It is recommended to take 2~3 samples with expected large difference to do pre-experiment before formal experiment and dilute the sample according to the result of the pre-experiment and the detection range (2.1-92.8 U/L).
The recommended dilution factor for different samples is as follows (for reference only):
| Sample type | Dilution factor |
| Human plasma (serum) | 1 |
| Horse serum | 1 |
| Rat serum | 1 |
| Rabbit serum | 1 |
| Porcine serum | 1 |
| 10% Rat kidney tissue homogenate | 1 |
| 10% Rat brain tissue homogenate | 1 |
| 10% Rat liver tissue homogenate | 1 |
| 10% Rat spleen tissue homogenate | 1 |
| 10% Rat lung tissue homogenate | 1 |
Note: The diluent is normal saline (0.9% NaCl) or PBS (0.01 M, pH 7.4).
Detection Principle
GDH catalyzes the dehydrogenation of glutamate, meanwhile, NAD+ is reduced to NADH, Which under the action of hydrogen transmitter, transfer electrons to WST-8 to produce the yellow product. The activity of GDH can be calculated by measuring the change of absorbance value at 450 nm.
Kit Components & Storage
| Item | Component | Size (96 T) | Storage |
| Reagent 1 | Substrate | Powder ×1 vial | 2-8℃, 12 months |
| Reagent 2 | Stock Diluent | 12 mL × 1 vial | 2-8℃, 12 months |
| Reagent 3 | Stop Solution | 50 mL × 1 vial | 2-8℃, 12 months |
| Reagent 4 | Phosphate | 15 mL × 1 vial | 2-8℃, 12 months |
| Reagent 5 | DTNB Solution | 5 mL × 1 vial | 2-8℃, 12 months, shading light |
| Reagent 6 | Standard | Powder ×1 vial | 2-8℃, 12 months |
| Reagent 7 | Standard Stock Solution | 3 mL × 1 vial | 2-8℃, 12 months |
| Microplate | 96 wells | No requirement | |
| Plate Sealer | 2 pieces |
Note: The reagents must be stored strictly according to the preservation conditions in the above table. The reagents in different kits cannot be mixed with each other. For a small volume of reagents, please centrifuge before use, so as not to obtain sufficient amount of reagents.
Technical Data:
Parameter:
Intra-assay Precision
Three human serum samples were assayed in replicates of 20 to determine precision within an assay (CV = Coefficient of Variation).
| Parameters | Sample 1 | Sample 2 | Sample 3 |
| Mean (U/L) | 5.60 | 34.80 | 79.50 |
| %CV | 2.1 | 1.7 | 1.6 |
Inter-assay Precision
Three human serum samples were assayed 20 times in duplicate by three operators to determine precision between assays.
| Parameters | Sample 1 | Sample 2 | Sample 3 |
| Mean (U/L) | 5.60 | 34.80 | 79.50 |
| %CV | 6.0 | 6.4 | 6.8 |
Recovery
Take three samples of high concentration, middle concentration and low concentration to test the samples of each concentration for 6 times parallelly to get the average recovery rate of 105%.
| Standard 1 | Standard 2 | Standard 3 | |
| Expected Conc. (μmol/L) | 55 | 118 | 180 |
| Observed Conc. (μmol/L) | 59.4 | 122.7 | 185.4 |
| Recovery rate (%) | 108 | 104 | 103 |
Sensitivity
The analytical sensitivity of the assay is 2.1 U/L. This was determined by adding two standard deviations to the mean O.D. obtained when the zero standard was assayed 20 times, and calculating the corresponding concentration.
Standard Curve
As the OD value of the standard curve may vary according to the conditions of the actual assay performance (e.g. operator, pipetting technique or temperature effects), so the standard curve and data are provided as below for reference only:
| Concentration (μmol/L) | 0 | 1.0 | 2.0 | 4.0 | 5.0 | 6.0 | 7.0 | 8.0 |
| Average OD | 0.054 | 0.117 | 0.238 | 0.310 | 0.374 | 0.450 | 0.574 | 0.691 |
| Absoluted OD | 0.000 | 0.063 | 0.184 | 0.256 | 0.320 | 0.396 | 0.520 | 0.637 |