


Direct Bilirubin (DBIL) Colorimetric Assay Kit
Couldn't load pickup availability

Still have questions? Ask our experts!
Direct Bilirubin (DBIL) Colorimetric Assay Kit
| SKU # | E-BC-K761-M |
| Detection Instrument | Microplate reader (565 nm) |
| Detection method | Colorimetric method |
Product Details
Properties
| Synonyms | DBIL |
| Sample type | Animal serum |
| Sensitivity | 0.6 μmol/L |
| Detection range | 0.6-50 μmol/L |
| Detection Method | Colorimetric method |
| Assay type | Quantitative |
| Assay time |
35 min |
| Precision | Average inter-assay CV: 8.600% | Average intra-assay CV: 4% |
| Other instruments required | Micropipettor, Vortex mixer, Centrifuge |
| Storage | 2-8℃ |
| Valid period | 12 months |
Images
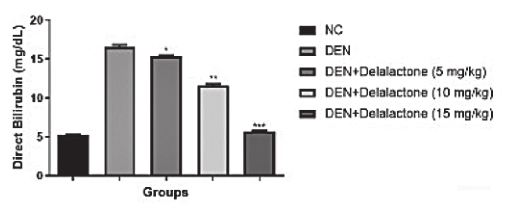
H Y Shen et al investigate the chemoprotective effect of decalactone on hepatic cancer. Direct bilirubin (DBIL) in rat liver was determined using DBIL colorimetric assay kit (E-BC-K761-M).
H Y Shen et al investigate the chemoprotective effect of decalactone on hepatic cancer. Direct bilirubin (DBIL) in rat liver was determined using DBIL colorimetric assay kit (E-BC-K761-M).
Dilution of Sample
It is recommended to take 2~3 samples with expected large difference to do pre-experiment before formal experiment and dilute the sample according to the result of the pre-experiment and the detection range (0.7-50 μmol/L).
The recommended dilution factor for different samples is as follows (for reference only):
| Sample type | Dilution factor |
| Human serum | 1 |
| Rat serum | 1 |
| Mouse serum | 1 |
| Rabbit serum | 1 |
| Chicken serum | 1 |
| Porcine serum | 1 |
Note: The diluent is normal saline (0.9% NaCl).
Detection Principle
Bilirubin is one of the important components of bile. It is the degradation product of hemoglobin in various heme proteins under the action of a series of enzymes. It is important to the digestion and absorption of lipids and the formation of yellow distemper. Bilirubin comes in two forms: water-soluble and water-insoluble. Bilirubin has powerful antioxidant, anti-inflammatory and autoimmune properties. The concentration of bilirubin in human body is related to sex, drug intake, age and so on. Low serum bilirubin is directly related to diabetes, metabolic syndrome, cardiovascular disease and other pathological states. However, high bilirubin is indicative of hemolysis, jaundice, Gilbert syndrome, hepatitis, drug toxicity, and possible bile duct obstruction.
Kit Components & Storage
| Item | Component | Size 1(48 T) | Size 2(96 T) | Storage |
| Reagent 1 | Acid Agent | 15 mL ×1 vial | 30 mL ×1 vial | 2-8℃, 12 months, shading light |
| Reagent 2 | Diazonium Salt | 5 mL × 1 vial | 10 mL × 1 vial | 2-8℃, 12 months |
| Reagent 3 | Stop Solution | 5 mL × 1 vial | 5 mL × 1 vial | 2-8℃, 12 months, shading light |
| Reagent 4 | Standard | Powder × 2 vials | Powder × 2 vials | 2-8℃, 12 months, shading light |
| Microplate | 96 wells | No requirement | ||
| Plate Sealer | 2 pieces | |||
Note: The reagents must be stored strictly according to the preservation conditions in the above table. The reagents in different kits cannot be mixed with each other. For a small volume of reagents, please centrifuge before use, so as not to obtain sufficient amount of reagents.
Technical Data:
Parameter:
Intra-assay Precision
Three human serum samples were assayed in replicates of 20 to determine precision within an assay (CV = Coefficient of Variation).
| Parameters | Sample 1 | Sample 2 | Sample 3 |
| Mean (μmol/L) | 2.50 | 23.40 | 45.50 |
| %CV | 4.5 | 4.1 | 3.4 |
Inter-assay Precision
Three human serum samples were assayed 20 times in duplicate by three operators to determine precision between assays.
| Parameters | Sample 1 | Sample 2 | Sample 3 |
| Mean (μmol/L) | 2.50 | 23.40 | 45.50 |
| %CV | 8.2 | 8.8 | 8.8 |
Recovery
Take three samples of high concentration, middle concentration and low concentration to test the samples of each concentration for 6 times parallelly to get the average recovery rate of 100%.
| Sample 1 | Sample 2 | Sample 3 | |
| Expected Conc. (μmol/L) | 12.5 | 26.5 | 42 |
| Observed Conc. (μmol/L) | 12.4 | 26.8 | 42.0 |
| Recovery rate (%) | 99 | 101 | 100 |
Sensitivity
The analytical sensitivity of the assay is 0.6 μmol/L. This was determined by adding two standard deviations to the mean O.D. obtained when the zero standard was assayed 20 times, and calculating the corresponding concentration.
Standard Curve
As the OD value of the standard curve may vary according to the conditions of the actual assay performance (e.g. operator, pipetting technique or temperature effects), so the standard curve and data are provided as below for reference only:
| Concentration (μmol/L) | 0 | 10 | 20 | 25 | 30 | 35 | 40 | 50 |
| OD value of standard | 0.039 | 0.079 | 0.125 | 0.152 | 0.176 | 0.197 | 0.216 | 0.274 |
| 0.037 | 0.079 | 0.125 | 0.148 | 0.173 | 0.202 | 0.219 | 0.271 | |
| Average OD | 0.037 | 0.079 | 0.115 | 0.150 | 0.174 | 0.200 | 0.217 | 0.273 |
| OD value of standard control | 0.037 | 0.041 | 0.041 | 0.041 | 0.041 | 0.041 | 0.041 | 0.044 |
| 0.038 | 0.039 | 0.042 | 0.040 | 0.042 | 0.041 | 0.041 | 0.044 | |
| Average OD | 0.038 | 0.040 | 0.041 | 0.041 | 0.041 | 0.041 | 0.041 | 0.044 |
| Absoluted OD | 0.000 | 0.039 | 0.074 | 0.109 | 0.133 | 0.159 | 0.177 | 0.229 |